


Streamlitで配列やリストを見やすく表示するには、複数の方法があります。主にst.write、st.dataframe、st.tableなどの関数を利用します。これらの関数を使うことで、データを整形してユーザーフレンドリーな形式で表示できます。
st.write
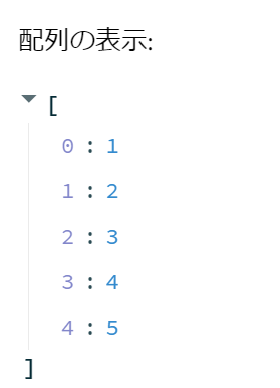
最もシンプルな表示方法の一つで、Pythonのリストや配列をそのまま渡すことができます。st.writeは多くのデータタイプに対応しており、自動的に最適な表示方法を選択します。
import streamlit as st

my_array = [1, 2, 3, 4, 5]
st.write("配列の表示:", my_array)
st.dataframe
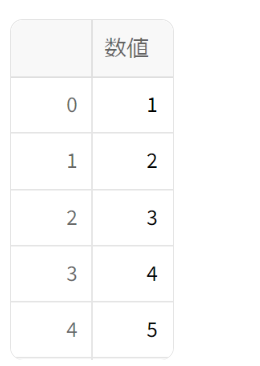
PandasのDataFrameを使用して、配列やリストを表形式で表示することができます。大きなデータセットに適しており、ソートやフィルタリングなどのインタラクティブな操作が可能です。
import streamlit as st
import pandas as pd

my_array = [1, 2, 3, 4, 5]
df = pd.DataFrame(my_array, columns=['数値'])
st.dataframe(df)
st.table
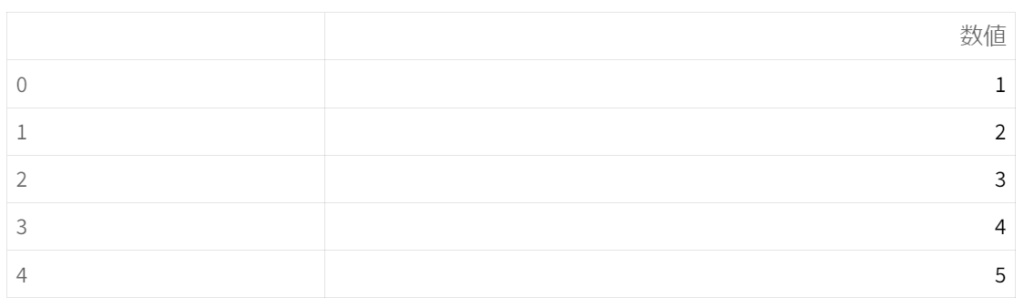
st.tableも表形式でデータを表示しますが、st.dataframeとは異なり、静的なテーブルを作成します。データのサイズが小さく、ユーザーによるインタラクションが不要な場合に適しています。
import streamlit as st
import pandas as pd

my_array = [1, 2, 3, 4, 5]
df = pd.DataFrame(my_array, columns=['数値'])
st.table(df)
配列の要素をリストとして表示
もし配列の要素をリストとして一つずつ表示したい場合は、st.writeやMarkdownを使用してカスタマイズできます。
import streamlit as st

my_array = ['りんご', 'ばなな', 'みかん']
st.write("配列の要素:")
for item in my_array:
    st.write("- ", item)

Markdownを使う方法。
import streamlit as st

my_array = ['りんご', 'ばなな', 'みかん']
st.markdown("### 配列の要素")
st.markdown('\n'.join(f'- {item}' for item in my_array))

これらの方法を使って、Streamlitで配列やリストのデータを見やすく表示できます。データの種類や目的に応じて、最適な表示方法を選択してください。